| Name | bezier() |
||||||||||||||||||||||||
|---|---|---|---|---|---|---|---|---|---|---|---|---|---|---|---|---|---|---|---|---|---|---|---|---|---|
| Examples |

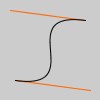
noFill() stroke(255, 102, 0) line(85, 20, 10, 10) line(90, 90, 15, 80) stroke(0, 0, 0) bezier(85, 20, 10, 10, 90, 90, 15, 80) 
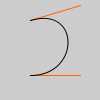
noFill() stroke(255, 102, 0) line(30, 20, 80, 5) line(80, 75, 30, 75) stroke(0, 0, 0) bezier(30, 20, 80, 5, 80, 75, 30, 75) | ||||||||||||||||||||||||
| Description | Draws a Bezier curve on the screen. These curves are defined by a series of anchor and control points. The first two parameters specify the first anchor point and the last two parameters specify the other anchor point. The middle parameters specify the control points which define the shape of the curve. Bezier curves were developed by French engineer Pierre Bezier. Using the 3D version requires rendering with P3D (see the Environment reference for more information). | ||||||||||||||||||||||||
| Syntax | bezier(x1, y1, x2, y2, x3, y3, x4, y4) bezier(x1, y1, z1, x2, y2, z2, x3, y3, z3, x4, y4, z4) | ||||||||||||||||||||||||
| Parameters |
| ||||||||||||||||||||||||
| Related |
bezierVertex() curve() |
Updated on Mon Sep 21 15:53:24 2020.
If you see any errors or have comments, please let us know.

This work is licensed under a Creative Commons Attribution-NonCommercial-ShareAlike 4.0 International License